 By Jim Hartman
Data analysis can be defined as the analysis of data to get valuable answers. It includes collecting and organizing the information, identifying the patterns, and clarifying what they indicate to help make the right decisions.

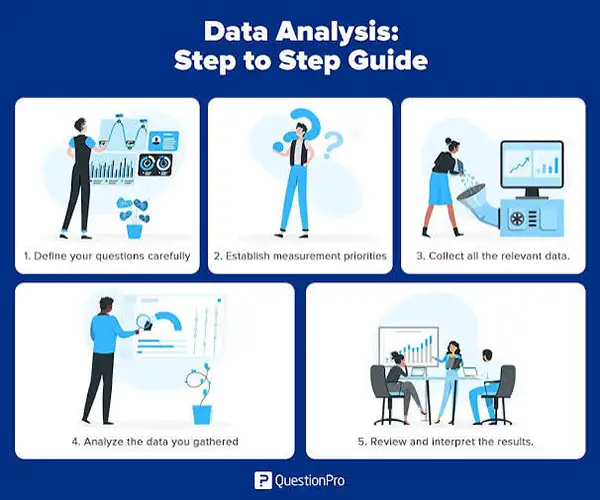
In this fast-paced world, companies are facing the challenge of collecting big data. High volumes of data have an impact on decision-making and can bring big profits, but collecting and transforming raw data has proven to be a more difficult task than previously thought, and this is where data analysis comes into play. Data analysis is a practice of examining and transforming various data in order to answer specific questions. In this guide, we will introduce the term data analyzing and explain how it works, its processes, methodologies, examples, etc.
The process of collecting, cleaning, organizing, transforming, describing, modeling, and interpreting raw datasets are called data analysis that allows individuals to arrive at conclusions and make decisions based on that. It allows companies to examine the data and see different connections as well as trends within the data. Businesses often rely on effective data processing to prepare information for analysis and ensure that it is usable.
In simple words, data analysis is a straightforward way to provide an understanding based on raw data.
Data analysis is not only about seeing numbers but also about applying various methods and approaches to achieve clarity and useful information.
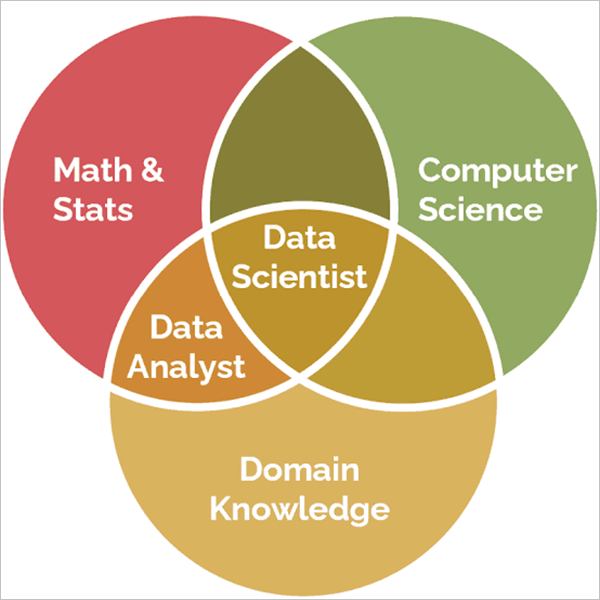
Although data analysis, data analytics, and data science are frequently used interchangeably, they have some differences.
Data analysis is defined as working with a particular dataset to find the answers to a specific question or to understand what happened.
Data analytics is a broader term that can include data analysis and has many different technologies and methods to implement it on a larger scale.
Data science is even wider than the previous definition and involves numerous methods of working with enormous volumes of complicated information.
For instance, an analyst may study sales figures from the previous year to find out the reasons for revenue decrease. A data analysis group may work on the results to find ways to improve sales and develop a machine learning model to predict sales numbers for future periods.
Data analysis is essential in decision-making since decisions based on evidence are better than those made on gut feeling.
Data analysis helps to:
In brief, data analysis refers to the process of evaluating data to identify significant statistics, reach decisions, and make wiser choices. It transforms raw data to knowledge that can be applied to resolving a problem, planning, and future development.
Step1. Formulate the question and objectives
Change the vague aim to a concrete question that can be measured with data. For instance, “Why has the fall in repeat purchases been 12% last quarter?”
Step2. Collect the data
Collect relevant data from internal systems or recently conducted research. Businesses may also use data extraction to obtain useful information from documents, databases, websites, and other sources.
Step3. Clean and prepare the data
Data quality callout: Bad input leads to bad output. Even if the model is well built, it won’t help make correct conclusions based on wrong data. Following proper data quality management practices helps maintain accuracy, consistency, and reliability throughout the process.
Step4. Explore the data
Analyze averages, dispersion, distribution, and outliers to identify the signs of the problem.
Step5. Analyze and model
Choose the technique that can be applied in your case: comparison, correlation or regression, or prediction.
Step6. Interpret and visualize
Make sense of the results with reference to the question mentioned before and show them in the chart.
Step7. Report and act
Publish the results and the practical outcome of data analyzing, followed by measuring the success of your actions.
Data analysis is usually divided into four types; each type creates a foundation for the next one, which leads from past analysis to the decision about the next action.
It summarizes the historical data in terms of totals, averages, and trends. This is the very first stage of analysis because descriptive analysis is the base for nearly all dashboards and reports.
Diagnostic analysis refers to the process of identifying the reasons for a scenario by making comparisons between different groups, finding out patterns and identifying the links between different parameters.
Predictive analysis is concerned with the use of historical data to provide insights into future events such as demand and churn. The output is represented as a probability rather than certainty.
Prescriptive analysis is the process of providing insight into the best actions to take after considering the possible options given their constraints and objectives.
| Type | Question answered | Typical technique | Example |
| Descriptive | What happened? | Statistical description of facts | Analyzing trends in sales |
| Diagnostic | Why did it happen? | Analysis of causes | Identifying causes of sales decline |
| Predictive | What is likely to happen? | Forecasting | Forecasting future sales |
| Prescriptive | What should we do? | Optimization, | Determining the optimal pricing |
In most instances, analysis is classified into either quantitative or qualitative. Quantitative analysis deals with numbers and involves estimating how many, how much, or how often, while qualitative analysis is usually concerned with words, pictures, and observations and aims to comprehend the reasons why people behave, feel, or think in a way they do. Neither of these two forms is superior to the other as they provide answers to different questions, and the selection of the right one is possible only after determining what needs to be learned.
| Quantitative analysis | Qualitative analysis | |
| Data type | Numerical and structured | Non-numerical and unstructured |
| Goal | Identifying patterns and trends | Learning views and experiences |
| Common techniques | Surveys, statistics, regression analysis. | Interviews, observation, analysis of themes. |
| Typical outputs | Graphs, percentages, statistics. | Themes, descriptions, conclusions. |
| Example | Measuring the customer satisfaction rate. | Understanding customers’ satisfaction |
In general, quantitative results tell you what is happening and how big it is, while qualitative results help you to find out why this is happening: the example given in the last row illustrates the relation between the numbers (the problem is revealed) and the interviews (the cause is found).
Mixed-methods data analyzing utilizes a combination of quantitative and qualitative approaches, using triangulation to compare results from various methods.
For example, a company might conduct surveys to measure customer satisfaction while also running interviews to get insights on what customers think.
Learn more about the different research methods in our guide.
Data analysis methods help to organize, process, and analyze data in order to identify valuable insights. The appropriate method depends on the goal of research and the nature of the data collected.
Here are 9 commonly used data analysis methods with explanations of how to use them.
Describes data using basic measurements like mean, median, mode, range, standard deviation, and frequency distribution.
When to use: If the purpose of the data analysis is to identify the main trends related to the data at hand.
Example: Average monthly sales in a store.
Uses sample data to conclude the larger population.
Usage: When researchers want to test hypotheses or compare two groups.
Example: Application of t-tests for comparing the customer satisfaction levels in two stores.
Regression is the analysis of relationships between variables; correlation is the measurement of the degree and direction of relationships between variables.
Usage: To understand and evaluate how different variables are connected to one another.
Example: Estimating whether the advertising spending does impact sales.
This method allows one to find the underlying factors causing relationships between many variables.
Usage: To simplify the complicated data into smaller groups of correlated variables.
Example: Grouping responses of surveys into factors like quality, cost, and customer service.
Classifies similar data items according to mutual attributes.
Usage: To determine consumer divides and uncover trends in vast collections of information.
Example:: Classifying clients into clusters according to buying practices.
Studies information gathered in the course of time to identify tendencies, seasonal trends, and changes.
Usage: To examine past trends and project outcomes in the future.
Example: Determining demand for goods in a certain month with historical sales data.
Analyzes texts, interviews, and other qualitative data to find recurring concepts and ideas.
Usage: To discover one’s thoughts, feelings, and opinions, and customer feedback.
Example: Analyzing reviews to determine common complaints.
Generates hypotheses based on information obtained instead of testing a theory.
Usage: When researching information with very limited prior knowledge.
Example: Conducting interviews with workers to create a theory of motivation.
Merges findings from several studies to show the final results.
Usage: When analyzing existing research and revealing general trends.
Example: Merging results of different studies for medical research.
Use these data analysis techniques to rectify your available data.
This involves rectifying errors, duplications, and inconsistencies in the data, while transforming it for possible analysis.
When to use it: Take data preparation into consideration whenever conducting any operations with data sets.
The goal of EDA is to understand a dataset through initial screening using tables, charts, and outliers, before committing to a specific study.
When to use it: Explore the EDA method whenever you acquire a new dataset or feel uncertain about potential problems that can be addressed with it.
This method consists of getting meaningful information from vast amounts of numerical data by using charts and graphs.
When to use it: Use data visualization method whenever you need to identify a pattern quickly or present some information in a simple and clear manner.
This tool classifies necessary information about customers, products, or records with similar types of behavior in order to find meaningful distinctions in data.
When to use it: Use segmentation whenever you see that average values conceal important differences in the available.
This is the practice of recording the changes undergone by a certain metric over a certain period, while searching for trends, anomalies, and recurring patterns.
When to use it: When you want to check whether a modification is a long-term change or is only a temporary fluctuation.
Setting up a straightforward hypothesis, for example, “the new subject line brings more opens,” and testing whether it is true or not based on data obtained, usually, through A/B tests.
When to use it: Before implementing a modification to avoid making random conclusions about the results.
Training the model on the historical data to predict future outcomes, such as churn, demand, and quality of leads.
When to use it: When there is a need for planning and enough quality historical data is available for learning.
Analysis of various reviews, survey responses, Emails, or social media posts to identify the most common themes of the feedback and whether its tone is positive, negative, or neutral.
When to use it: When there is too much written feedback to read manually.
Performing the activity helps understanding the concepts in a better way. The data analysis examples below each consist of the same components: research problem, data included, analytical technique, and result. The data used in each example is illustrative for educational purposes.
Research problem: What causes for flat sales despite a rise in website traffic?
Data included: Two-year order history, customer data, and website traffic data.
Analytical technique: Time series analysis separating the seasonality effect from the actual trend, clustered afterwards by purchase behavior.
Outcome: Traffic growth is attributed to first-time visitors who rarely purchased again. The revenue was generated from a small group of loyal customers. The company has introduced a loyalty program for first-time clients.
Research problem: Can a new physiotherapy program provide a quicker recovery for knee surgery patients?
Data included: Recovery time and movement scores for 300 patients divided into two groups: experimental and control.
Analytical technique: Inferential statistics were employed, including the t-test and regression analysis, reflecting the initial age and health data of participants.
Outcome: The patients who benefited from the program recovered roughly two weeks faster on average, and this trend remained even when age factors were considered. As a result, the program was implemented further throughout the institution.
Issue: What payments are suspicious?
Data Used: Transaction history and payment amounts.
Method Used: Anomaly detection and predictive analysis.
Outcome: Flagging suspicious payments for examination.
Issue: What advertising campaigns are the most profitable?
Data Used: Visitor and click rates, lead conversion, and sales data.
Method Used: Efficiency analysis and attribution analysis.
Outcome: Discovering successful advertisements and making advertising budgets more effective.
Issue: Where problems and delays appear in business operations?
Data used: Product manufacturing reports, delivery reports, and supply reports.
Method Used: Process analysis and trend analysis.
Outcome: Eliminating errors and improving operations.
The provided examples demonstrate how data analysis turns raw facts into useful information and enables organizations to improve their performance.
The best tool to tackle your challenge is the one meeting the following criteria – it must be right for your question, your information available, and your skills. The table below provides a comparison of the most popular tool choices. Businesses can also explore different data entry tools to support the collection and preparation of information before analysis.
| Tool | Best for | Pros | Cons |
| Excel | Simple data analysis and spreadsheets | Easy to use, inexpensive and accessible | Not great for big datasets |
| SQL | Managing and querying data | Quick data access and effective management of the database | Requires knowledge of SQL commands. |
| Python | Automation, statistical analysis and machine learning | Very flexible and powerful with a lot of libraries available | Programming skills will be needed. |
| R | Statistical and analytical research | Good software and visualization | Harder to learn for beginners. |
| Tableau or Power BI | Visualizing and creating dashboards with data | Interactive reports and simple visualization | Some functionalities require paying for it. |
| SPSS | Statistical and academic research | User-friendly statistical analysis tool | Can be costly. |
| NVivo | Qualitative analysis | Organizing interviews, documents, and topics | Paid software with a learning curve. |
There are three important criteria one must consider when choosing the tool:
Experience: Novices should work with Excel and Power BI, while professional analysts will prefer to use Python, R, or SQL.
Data Size: Excel is a good option for small datasets, while SQL and Python may be much more effective with big data.
Budget: Think of free software like Python, R, and paid software such as Tableau, SPSS, and NVivo.
Selecting the right tool simplifies data evaluation, boosts effectiveness, and enables you to make more valid conclusions.
Data analysis is accurate as long as good-quality data is collected, appropriate methods are used, and proper interpretation is done. To obtain trusted results, perform the following:
For your results to be more reliable, avoid the following common mistakes:
Data analysis cannot be trustworthy without the correctness of the data being analyzed. Wrong, incomplete, or poorly structured input can result in erroneous outcomes and poor business decisions. This is the reason why data quality takes precedence over analysis.
For analysis purposes, a business must ensure the correctness of data entering, proper cleanliness and validation of data, as well as structured storage of the necessary data. Organizations handling large volumes of information may also use a data lake to store information from multiple sources in a centralized environment.
By doing this at the beginning of the process, analysts will avoid redoing the same corrections on each project, and it also guarantees that all the figures in the report come from accurate and verified records.
Support from AI and RPA:
Let’s automate the tasks of data input, checking, and processing.
Automated technology performs a large chunk of the tedious work in the process. Robotic process automation (RPA) is capable of transferring information between various systems, performing repetitive checks, and filling in structured data correctly and consistently without human help. Businesses can implement data entry automation to reduce repetitive manual tasks and improve the consistency of their records.
With the help of AI, unstructured data can be processed, relevant data can be extracted, unusual numbers can be detected, and errors can be fixed. Technologies such as optical character recognition (OCR) can also convert text from scanned documents and images into machine-readable information. Even though automation does not eliminate the necessity for human analysis, it minimizes the time devoted to routine operations and decreases the errors of human input.
Dataqix offers companies high-quality data-entry and data processing services that enhance the accuracy and consistency of data. With the help of its consistent data and well-organized processes, Dataqix provides the foundation for correct decision-making.
Companies that need additional support with large-scale data management can also consider data processing outsourcing or outsourced data entry to manage repetitive information-handling tasks efficiently.
Outsourcing can also help businesses reduce operational workloads and focus on their core activities. Understanding the benefits of outsourcing data entry can help organizations evaluate whether external support is suitable for their data management requirements.
Data analysis can be defined as the analysis of data to get valuable answers. It includes collecting and organizing the information, identifying the patterns, and clarifying what they indicate to help make the right decisions.
The primary methods of data analysis include descriptive statistics, inferential statistics, regression analysis, correlation analysis, factor analysis, cluster analysis, time series analysis, content analysis, thematic analysis, and grounded theory. Your choice of method should depend on your research question and type of data.
Methods refer to the analytical methods used in studies such as regression or cluster analysis where techniques refer to how methods are practically applied to real data (for instance, techniques include cleaning, visualization, and segmentation).
The four types include descriptive (what happened), diagnostic (why it happened), predictive (what is going to happen), and prescriptive (what to do). Each one builds on the previous one.
A retailer with flat sales numbers sees that their web traffic has increased. Using time series and customer cluster analysis, they realize that most visitors make one purchase and then leave, with only a small group of very loyal customers contributing to sales. The retailer implements a loyalty program for new customers.
Excel and Power BI are the easiest to begin with. Once you are comfortable, it is best to learn SQL next, as it is the most useful for working with business data.
The quality of analysis largely relies on the quality of the data; the presence of erroneous data, duplicates, and missing data can mislead the analysis and ultimately lead to wrong conclusions. Hence, performing data cleaning and validation before analysis is paramount for the integrity of analysis results.
Good analysis follows a clear set of steps: first define a question, followed by collecting and cleaning relevant data, exploring data, applying appropriate methods to process it, interpreting the results, and finally deriving a conclusion. Improvements made to early steps will improve the final results.
The main factors that determine which data analysis methods to opt for
Do you want to describe the situation, explain it, predict its development, or recommend something?
What type of data are you using (numeric or textual)? How much of it is available for the analysis?
Is it important for you to get fast results or do thorough research?
Match these to choose the appropriate methods you require to validate your results.
If your data analysts are impeded by messy records, manual entry, or unstructured documents, then we have the solution for you. The Dataqix team can provide perfect data entry, cleaning, validation, and structuring with the help of artificial intelligence and robotic process automation, so that you can work with clean data.
In this fast-paced world, companies are facing the challenge of collecting big data. High volumes of data have an impact…
November 18, 2026
Primary vs secondary research comes down to one question: did you collect the data yourself for this study, or are…
October 28, 2026
Every type of business needs information to operate in the most efficient way, boosting productivity. Thus, learning about data collection…
October 9, 2026
AI and machine learning have stepped out of laboratories to be used in a multitude of everyday products. Some of…
September 14, 2026
When you see the padlock icon on your computer or visit a secure website, something immediately clicks within the invisible…
August 27, 2026
Markdown is a type of lightweight markup language that is used to represent plain text in a structured way. It…
August 21, 2026 By Team Dataqix
 By Tina Brown